
You finish a rolling group ride with 200 W average power and 250 W normalized power. Which number describes your ride? Both are useful, but they answer different questions. Start by separating the power you produced from a model of how demanding that pattern of power was.
What is the difference between power and average power?
Power is the rate of doing mechanical work, measured in watts (W). The number on your bike computer describes your output at that moment, often smoothed over three or ten seconds so it is easier to read. Average power summarizes a selected interval or the whole ride.
For equally spaced samples, average power is their arithmetic mean. With irregular sampling, it needs to account for how long each value applies. Include genuine zero-power periods, such as coasting, when describing output across that same riding time.
Average power also gives you mechanical work: work (kJ) = average power (W) × duration (seconds) ÷ 1,000. An hour at 200 W produces 720 kJ at the power meter. This is mechanical energy, rather than a direct measurement of calories burned.
What is normalized power?
Normalized Power® (NP®) is a metric developed by Andrew Coggan. It estimates the steady power associated with a similar physiological demand to a variable effort. Hard sections receive more weight because their demands do not simply cancel out against easy sections. NP remains a model, rather than a measurement of your fatigue. [1]
The calculation uses the recorded power stream: [2]
- Calculate a rolling 30-second average of power.
- Raise each of those smoothed values to the fourth power.
- Take the mean of the resulting values.
- Take the fourth root of that mean to return a value in watts.
The rolling average and fourth-power weighting both matter. NP is not the average of your hardest efforts, and it is not calculated by raising the whole-ride average to the fourth power.
Same average power, different normalized power
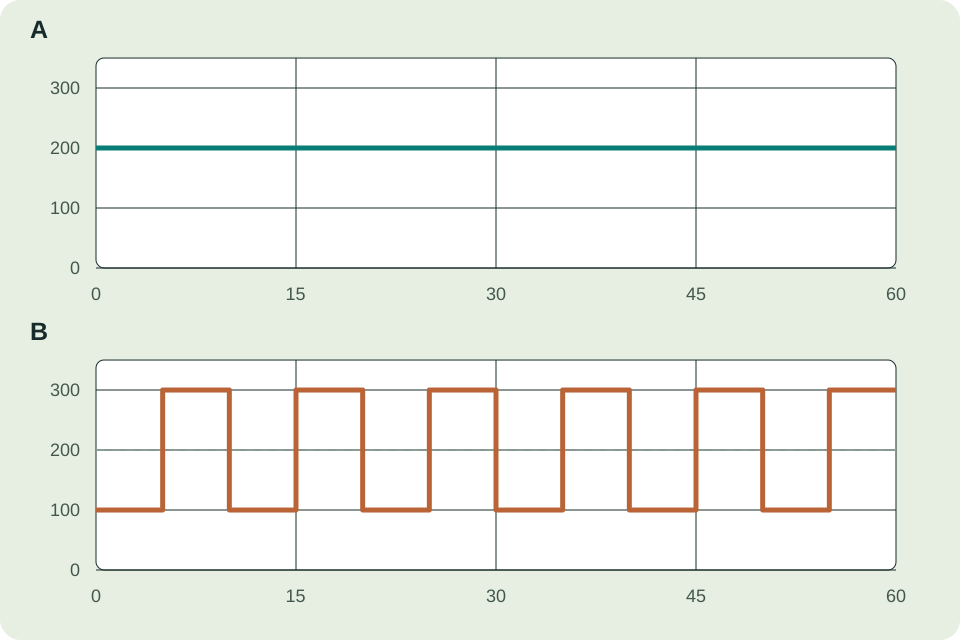
Consider two hypothetical one-hour rides with no pauses or missing samples. Ride A stays at 200 W. Ride B alternates five minutes at 100 W with five minutes at 300 W, repeated six times.
| Ride | Average power | Normalized power | Mechanical work |
|---|---|---|---|
| A: steady | 200 W | 200 W | 720 kJ |
| B: alternating | 200 W | 251 W | 720 kJ |
Both rides produce 720 kJ of mechanical work. The calculation gives B about 251 W NP (250.6 W before rounding), compared with 200 W for A. The higher NP reflects the weighting of the 300 W blocks. It does not mean B produced 251 W on average or did more mechanical work.
Your FTP and the duration of the hard blocks determine how demanding this session is for you. These simulated values illustrate the calculation; they do not establish an exact physiological equivalence for every rider.
What does the gap between the numbers tell you?
The gap tells you how uneven the ride was. If average power and normalized power are close, your effort was fairly steady. If normalized power is much higher, you mixed harder efforts with easier riding. The easy parts pull down your average, while normalized power gives the hard parts more weight.
Think of a group ride where you ride easily for a while, then push hard to close a gap or get over a hill. You can finish with a fairly low average even though those efforts made the ride hard. A larger gap makes sense in that situation. If you were aiming for a steady endurance ride, it is a reason to check how often you rode harder than intended.
You can express the difference as a ratio called Variability Index (VI): normalized power divided by average power. For example, 250 W NP divided by a 200 W average gives a VI of 1.25. Closer to 1 means steadier riding. A higher number means more variation, so judge it against what you were trying to do on that ride. [4]
Should you use average power or normalized power?
Use average power to check an effort. Use normalized power to review a ride with lots of changes in pace.
For intervals, look at the average for each work interval, leaving the recoveries out. If your workout calls for four five-minute efforts at 300 W, check whether each one averaged about 300 W and whether you could keep it up through the last one. The whole ride’s NP cannot tell you whether you completed those intervals as planned.
For a sustained climb or a personal best, use average power over that effort. Holding 265 W for twenty minutes is a different achievement from recording 265 W NP during twenty minutes of surging and easing off. Use the continuous average when you want to know whether you can hold more power than before.
For a group ride, race or hilly route, look at NP alongside average power and duration. If you averaged 180 W but had 230 W NP, the easy sections have brought down the average while the hard sections still counted heavily. That helps explain why a ride with a modest average felt demanding. Compare it with rides of a similar duration and consider how it felt to you. [2]
While riding to a power target, follow your current power, usually smoothed over a few seconds. Use the interval average to check your pacing, then review the ride’s NP afterwards.
Using NP before a durability test
If you test your power late in a ride, look at NP for the riding before the test. End the selection where the test starts. This helps describe what you rode through before measuring how much power you could still produce.
For example, two rides could both reach the test after two hours at an average of 200 W: 1,440 kJ of work. One has 205 W NP; the other has 240 W NP. The second has a larger gap between average power and NP, showing more uneven riding with harder efforts.
If you produce less power in the test after the second ride, the harder build-up is one possible explanation. Do not assume your durability has worsened just because the test result is lower. A field study in male professional cyclists found greater performance losses after high-intensity work than after matched amounts of lower-intensity work. [5]
For a useful comparison, record:
- Before the test: duration, mechanical work, average power and NP. Compare NP with average power, or use VI, to describe how uneven the riding was.
- During the test: average power for the full chosen effort, compared with a similar fresh effort.
NP adds context; it does not measure fatigue directly. Two lead-ins with the same NP can still leave you feeling different. Keep fueling, conditions and the test itself as similar as practical when tracking changes.
What normalized power cannot tell you
Avoid using NP to judge short efforts. TrainingPeaks® advises ignoring it for selections shorter than roughly ten minutes. For a sprint or a three-minute interval, examine the actual power trace and average power for that duration. [3]
A high NP is not a new FTP result or a best sustained-power record. For example, 300 W NP in a variable ride does not demonstrate that you held 300 W continuously. Use average power over the relevant duration when reviewing your best efforts.
Higher NP is not automatically better. If an easy ride has become a series of hard surges, the higher number may show that you missed its purpose. Judge the ride against the session you intended to complete.
Review your next ride in this order: check the power data, note average power and duration, compare NP, then inspect the efforts that created the gap. Use the session goal to decide what to change.
Continue with power analysis:
Sources
- Andrew Coggan — Normalized Power, Intensity Factor and Training Stress Score
- Tom Epton — Understanding Normalized Power Calculations to Coach Cyclists
- TrainingPeaks Help Center — Normalized Power
- Dave Schell — An Introduction to TrainingPeaks Metrics: Part Two
- Mateo-March et al. — Is all work the same? Performance after accumulated work of differing intensities in male professional cyclists
Normalized Power® (NP®), Intensity Factor® (IF®), Training Stress Score® (TSS®), and TrainingPeaks® are registered trademarks of TrainingPeaks. TrainingPeaks trademark statement.