
A training block can finish with no new power records even when the riding is going well. You might have spent it riding long, steady efforts while your best five-minute power still comes from a race in spring. Without another hard five-minute effort, that part of the curve tells you little about the block.
The reverse happens too: your first properly paced effort on a long climb produces several records at once. You have demonstrated a better performance. How much came from training, pacing, freshness, or finally having a suitable road takes more investigation.
How a power curve is calculated
At each duration, a mean maximal power curve takes the highest average power from a continuous stretch of that length. Five-minute power can come from the middle of a longer effort. It is average power over the whole stretch, including any coasting, rather than normalized power.
Those best stretches can overlap. One strong twenty-minute climb might supply your best five, ten, fifteen, and twenty minutes. Four records from that climb are evidence of one performance; they give you no information about how well you could repeat it after recovery.
A season curve also combines different days, equipment, and states of fatigue. Its points do not describe a sequence of efforts you could necessarily complete in one ride. The research on power profiling makes a useful distinction: recorded best efforts describe demonstrated performance, while estimating maximum capability requires appropriate testing.
Which time periods to compare
An all-time or year-to-date curve is useful for asking, “Have I ever done this before?” Within a fixed year, a cumulative best can only stay level or rise as rides are added. It cannot show you losing fitness. A recent period can, but only if it contains efforts hard enough to reveal what you can currently do.
Suppose your best twenty minutes is 300 W from May. In October, your longest hard efforts are eight-minute intervals. An October twenty-minute best of 270 W is weak evidence of a decline: you have changed the question from a maximal twenty-minute effort to whatever twenty-minute stretch happened to occur in those sessions.
For a training-block comparison, use periods containing similar opportunities: comparable climbs, time trials, or deliberately paced efforts at the durations you care about. Pick the period before looking for a flattering result. If neither period contains a suitable effort, leave that duration unassessed.
How to check a new power record
Open the activity behind a new peak. Was the effort continuous? Did the power trace contain an implausible spike? Did you change meters? As a simple example, one erroneous second reading 1,000 W too high adds 200 W to a five-second average. It adds less than 1 W to a twenty-minute average. A sudden sprint record deserves a different data check from a sustained improvement.
Keep the power source consistent where possible. Testing of 54 power meters found meaningful differences between units. A few watts gained when switching from a trainer to pedals should prompt a comparison of the devices before a conclusion about training.
Then inspect the effort itself. A more even pace, a cooler day, or arriving better rested can explain a better result. That performance still counts. Reproducing it in comparable conditions makes it more useful for setting future targets.
FTP and critical power estimates
A twenty-minute best of 300 W gives 285 W when multiplied by 0.95. The arithmetic is exact; the estimate is dependent on the test and the rider. A best stretch extracted from a race also need not match the preparation and pacing of a dedicated test.
The two-parameter critical-power model illustrates why one duration cannot describe the whole profile: P(t) = CP + W′ ÷ t, with time in seconds and W′ in joules. CP is the model's power asymptote; W′ represents a finite work capacity above it. This model is fitted to suitable maximal efforts over several minutes, rather than extrapolated to sprints or all-day riding.
For illustration, CP of 280 W with W′ of 24 kJ gives 300 W at twenty minutes. So does CP of 290 W with W′ of 12 kJ. The same twenty-minute result is compatible with different model parameters. Fitting them requires efforts at multiple durations.
FTP and critical power are often discussed together, but they should not be substituted automatically. A study comparing a twenty-minute FTP test with critical-power testing found strong correlation alongside substantial individual disagreement. A strong relationship across riders does not guarantee that the two values agree for you.
Use a consistent assessment method when reviewing zones, and keep model estimates distinct from measured efforts.
How to use power curves for training
If your event turns on one fresh eight-minute climb, recent hard efforts around that duration are relevant. If it turns on the fifth climb, inspect the earlier repetitions, recovery periods, and power late in the ride. Two sessions can have the same best five minutes while the quality of the remaining intervals differs substantially.
A useful review ends with a specific question for the next session: can you reproduce the new power, sustain it longer, or produce it after more work? For that last question, see Durability: How to Measure Power Loss During a Ride.
How to view your power curve in Peak Watts
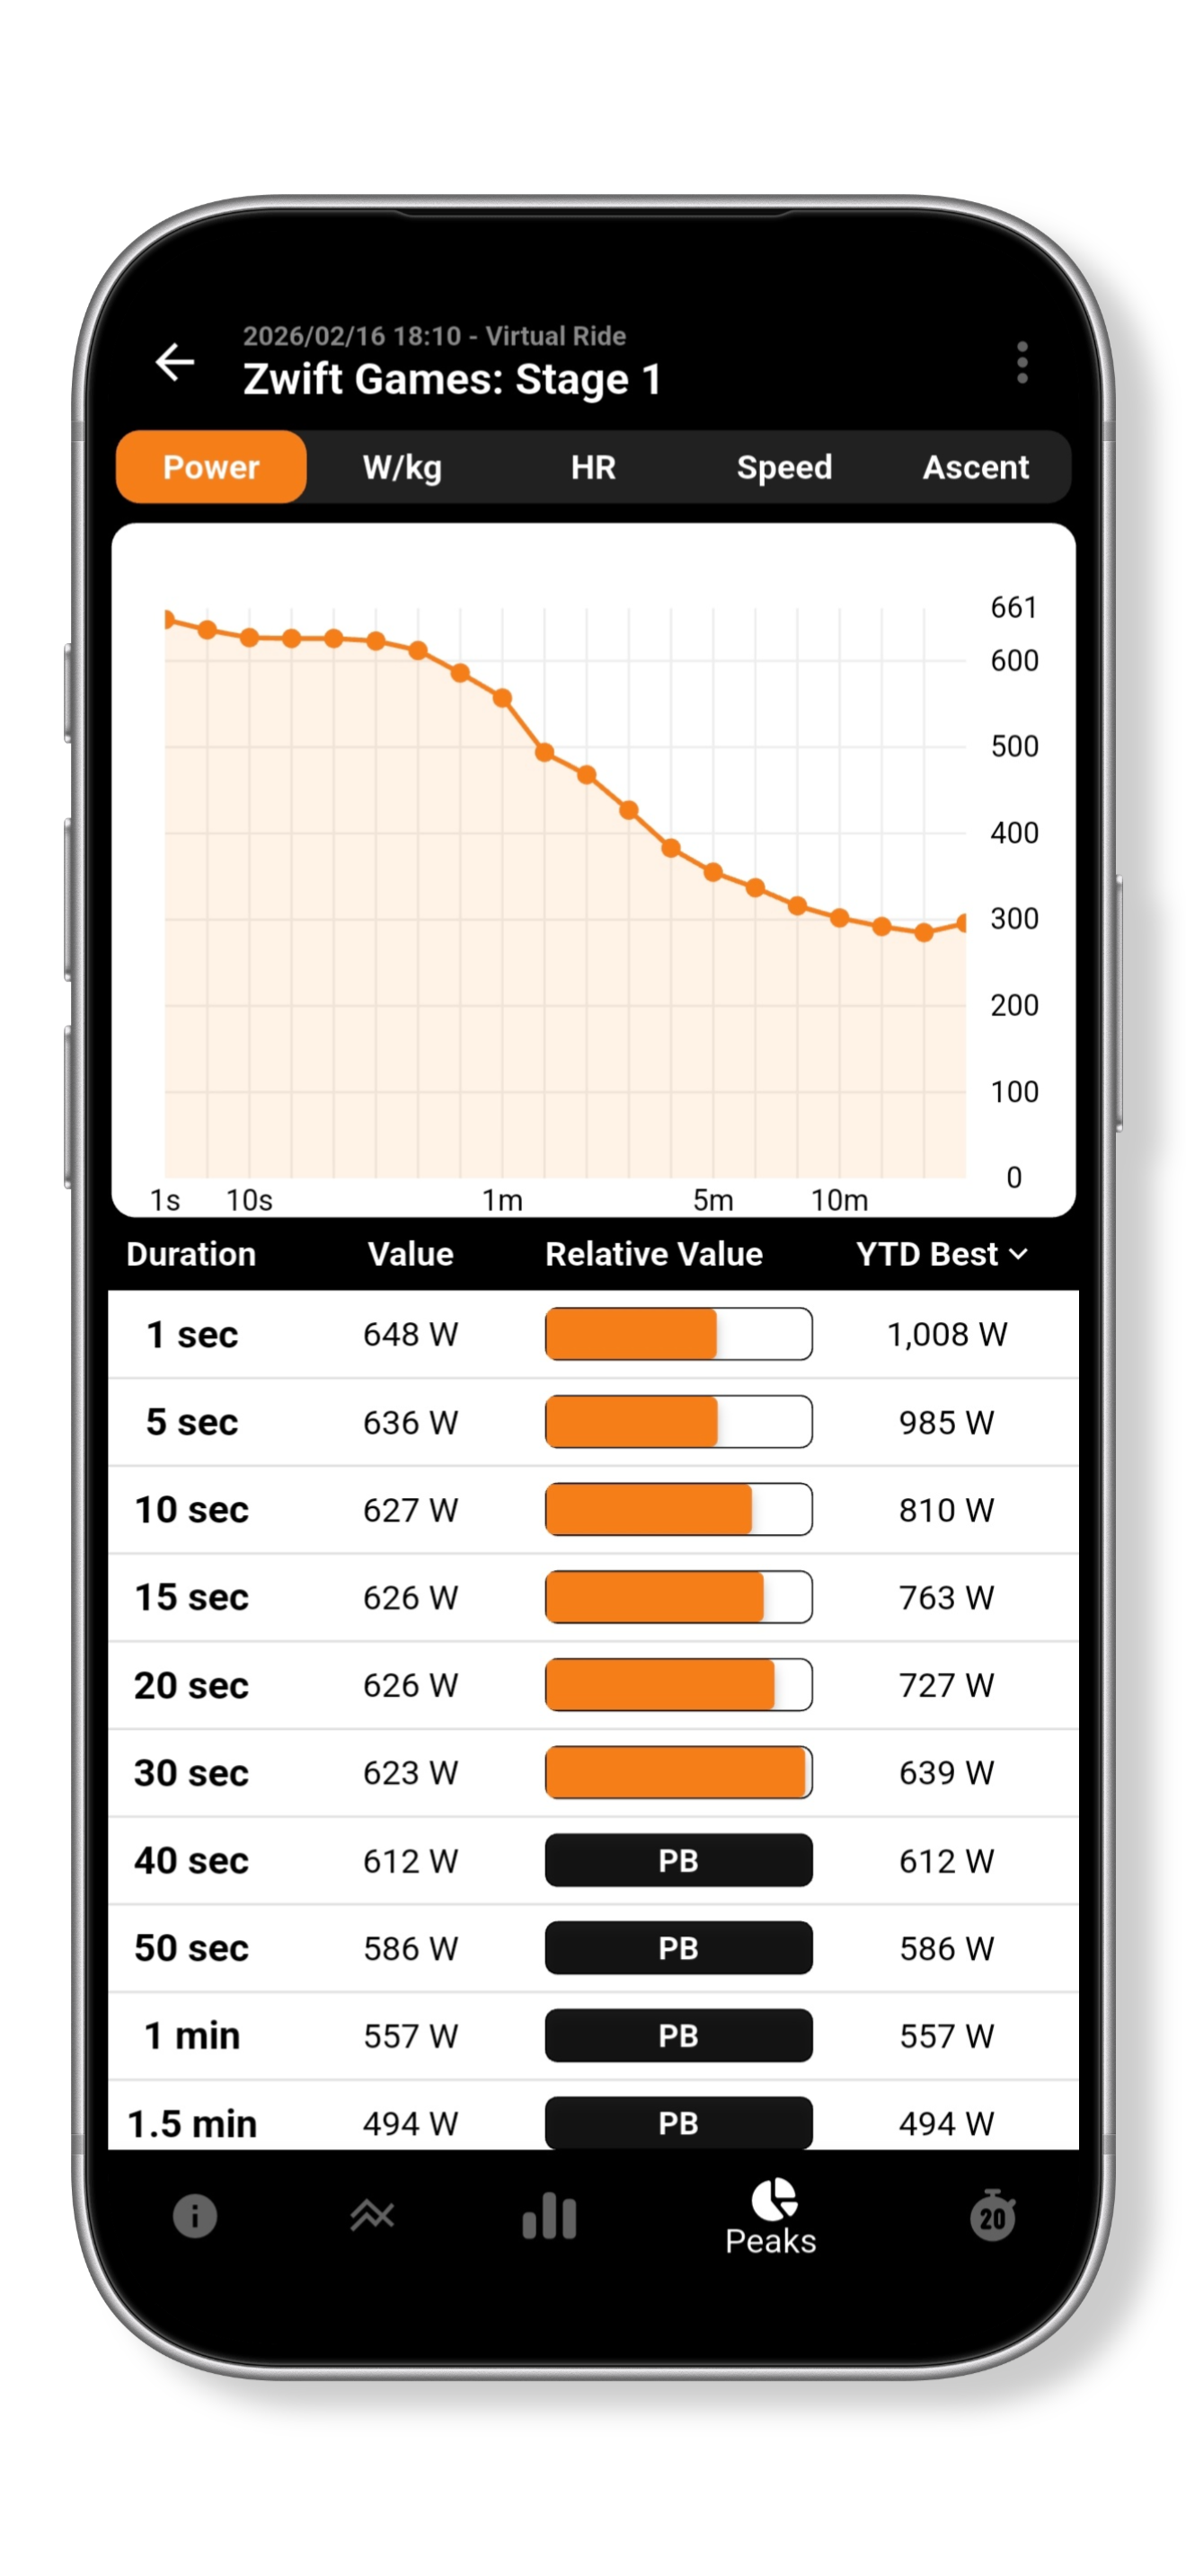
In an activity, open Peaks → Power and compare with YTD Best to locate the durations worth investigating. Then return to the effort and its context before deciding what to change in training.
References
- Leo P, Spragg J, Podlogar T, Lawley JS, Mujika I. Power profiling and the power-duration relationship in cycling: a narrative review. European Journal of Applied Physiology. 2022;122(2):301–316. doi:10.1007/s00421-021-04833-y.
- Maier T, Schmid L, Müller B, Steiner T, Wehrlin JP. Accuracy of Cycling Power Meters against a Mathematical Model of Treadmill Cycling. International Journal of Sports Medicine. 2017;38(6):456–461. doi:10.1055/s-0043-102945.
- Karsten B, Petrigna L, Klose A, Bianco A, Townsend N, Triska C. Relationship Between the Critical Power Test and a 20-min Functional Threshold Power Test in Cycling. Frontiers in Physiology. 2021;11:613151. doi:10.3389/fphys.2020.613151.